
Revenue Dashboard Overview
Business Context
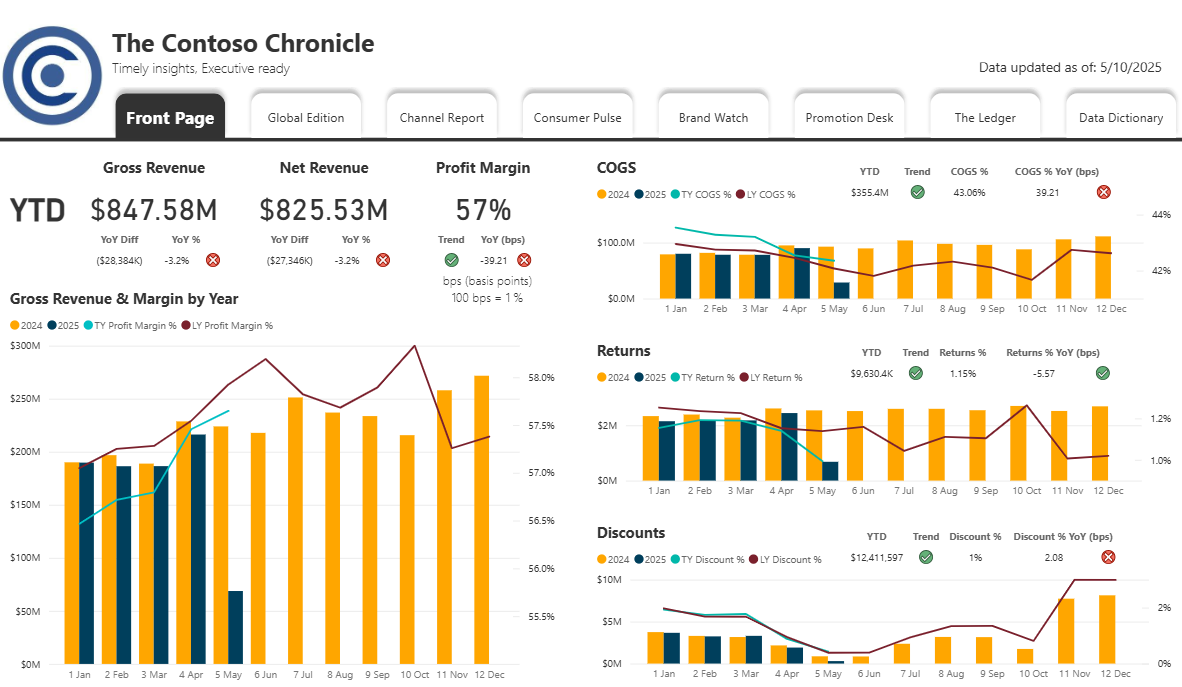
Monthly executive dashboard designed to surface key revenue insights at a glance: performance, trends, and year-over-year comparisons.
Interactive Demo (coming soon)
Key Metrics
- Gross Revenue & Net Revenue with Profit Margins
- Cost of Goods Sold (COGS), Returns, Discounts (YoY changes, basis points, and trend lines)
Tools & Data
- Platform: Power BI with DAX measures
- Sample Data: Contoso dataset (Microsoft)
Design Rationale
- Executive Clarity: Newspaper-style layout for quick decision-making
- Accessibility: Color-blind friendly palette tested via Coblis
- Focus: Practical KPIs and clear trend indicators
Stay tuned—this dashboard will be fully interactive soon! 🚀